Single-cell ATAC-seq output example
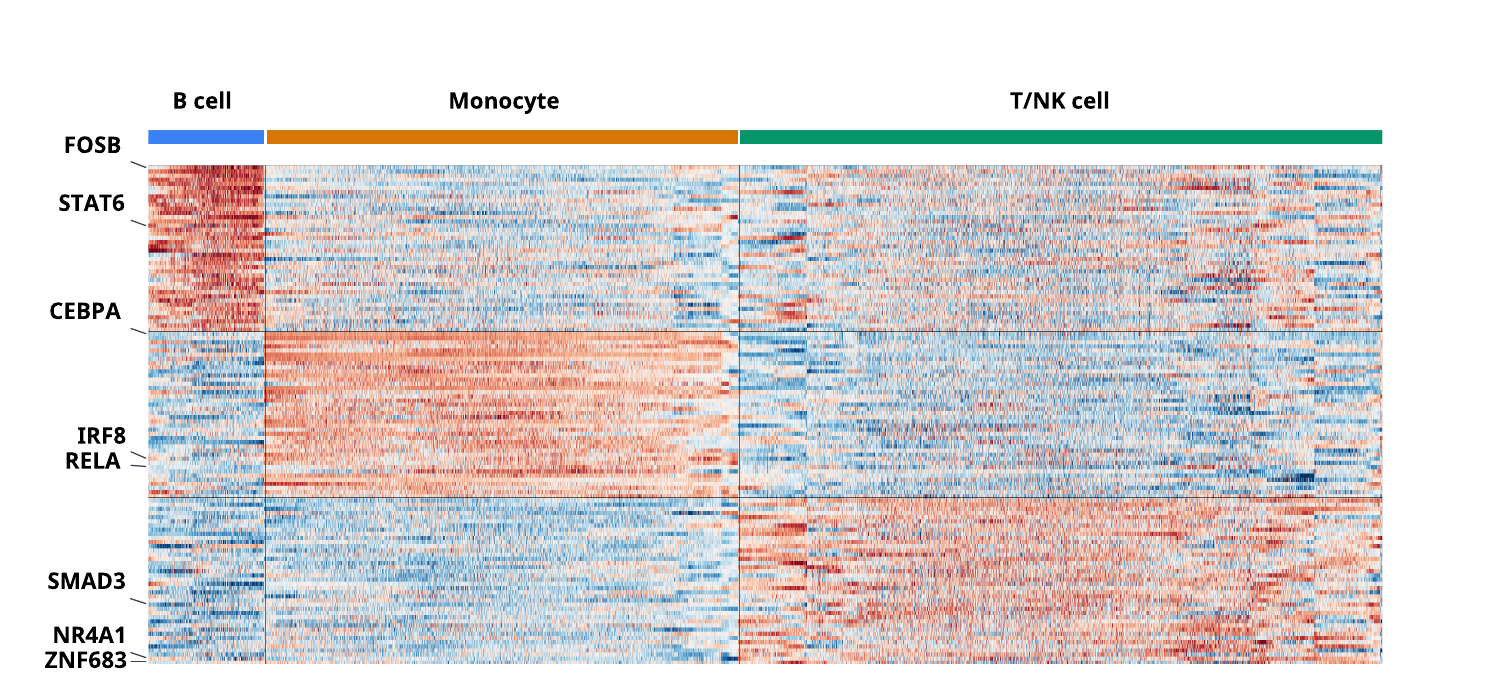
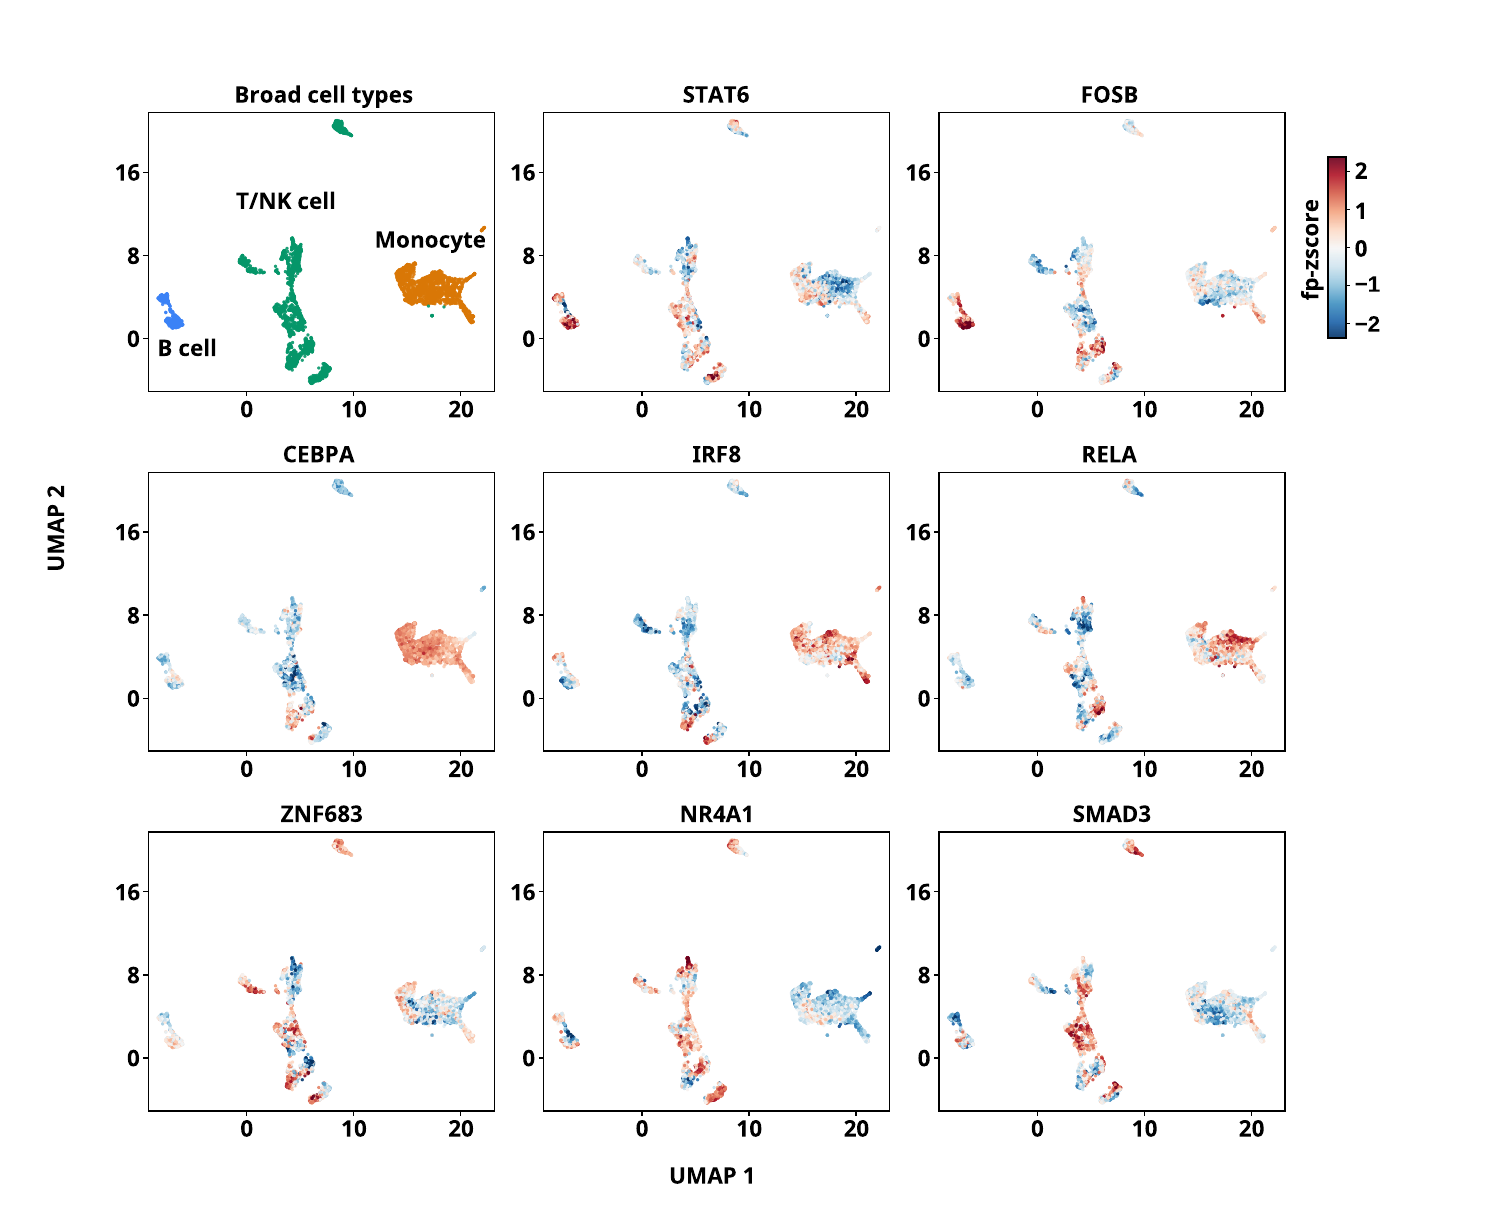
The PBMC5k example shows per-cell footprint signatures across B cells, monocytes, and T/NK cells.
To run a small, complete example yourself, follow the PBMC chromosome-22 tutorial. That 300-cell subset teaches the workflow; the figures here use the larger PBMC5k dataset and will differ.
Use the heatmap to compare motif signatures across cell groups. In the UMAPs, each panel places the same cells at the same coordinates; the colors show either cell labels or the selected motif's signature score. Similar colors within a group indicate a shared pattern of signal.
Signature heatmap
Eight marker UMAPs
Select either figure to open the full-resolution image. The Single-cell workflow describes the commands used to produce these outputs.
The signatures are smoothed using neighboring cells to reduce sparse signal. They describe relative motif-associated patterns, not direct measurements of TF binding in individual cells.